.jpg)


Agricultural Price Guide Tool
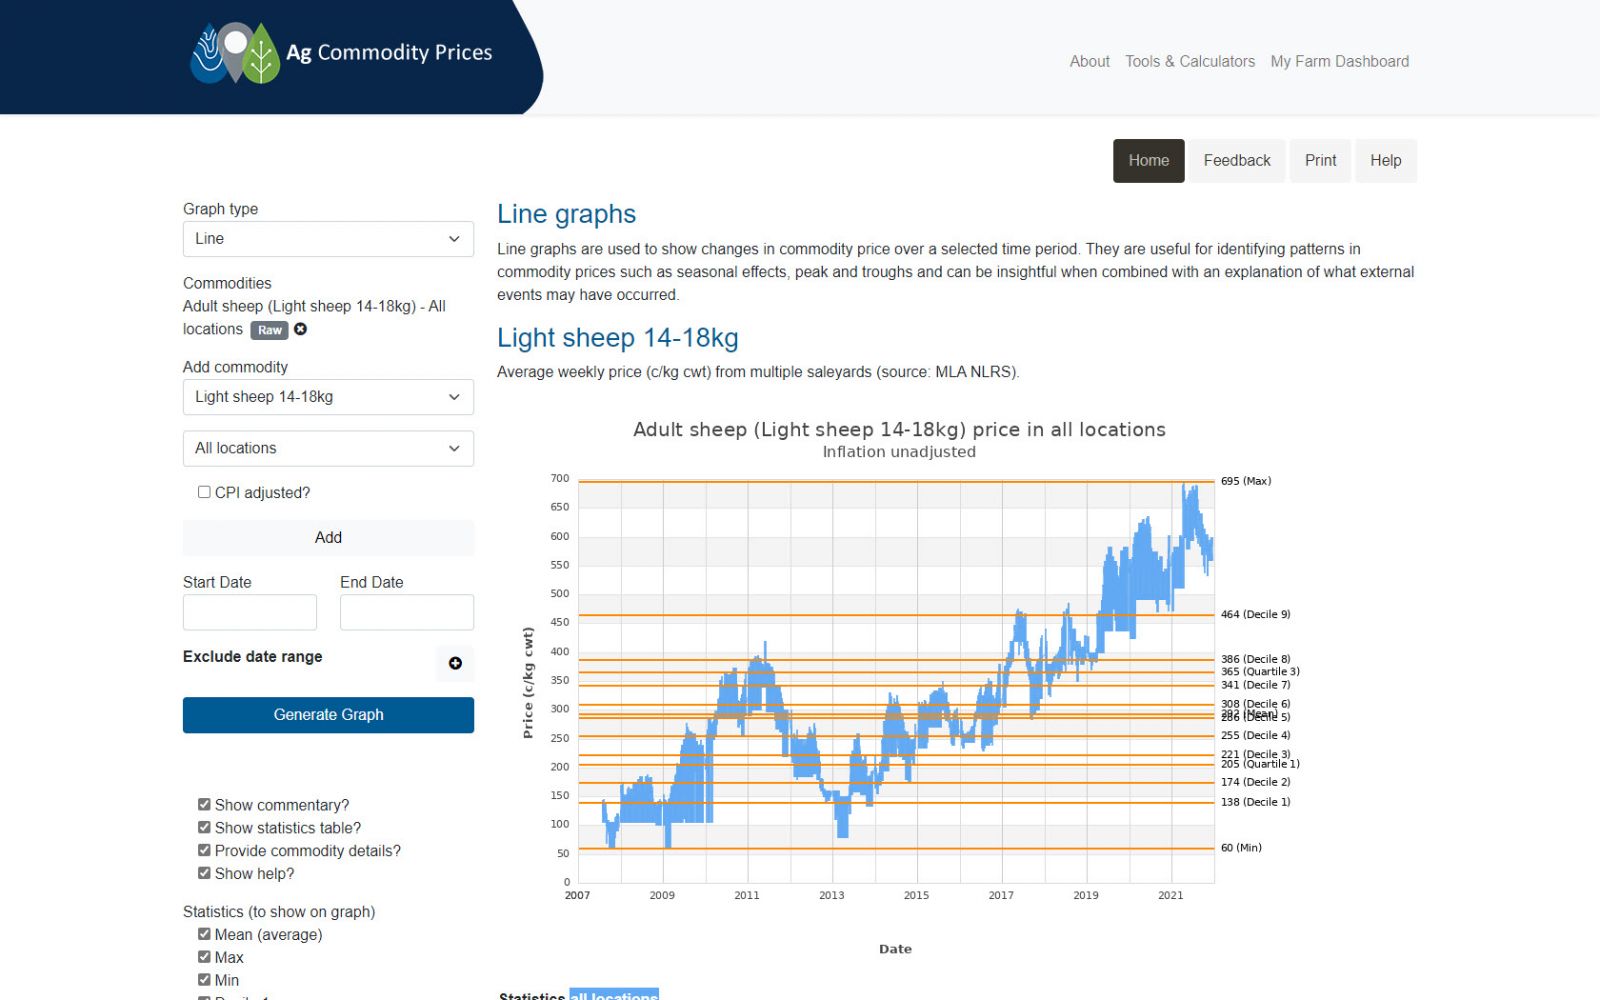
The Agricultural Price Guide is a web application developed to enable growers and agronomists to examine historic pricing information and fluctuations in prices for major agricultural commodities. The Price Guide is one of a series of custom applications developed for the Grain and Graze website.
 |
Background
Previously, access and interpretation of commodity sales data required manual collation and processing of multiple source datasets to produce customised one-off reports. This process was repeated every time a release of updated sales data occurred or when new versions of the report were requested. With the development of the Agricultural Price Guide Tool, users can access the aggregated sales data in one online location and produce customised graphical and tabulated reports on demand through an interactive user interface.
Outcomes
The Agricultural Price Guide Tool includes prices for multiple grains varieties, wool (17-30 microns), sheep, beef, goats, hay, and other commodities. Information is presented through a selection of graphs, statistical tables (mean, minimum, maximum, deciles) and correlations, adjustable for inflation. Information is updated annually in September for the previous end of fiscal year data (June).
The Agricultural Price Guide and other online applications hosted on the Grain and Graze website provide farmers with a national resource in which access to past and current information across core farming themes delivered through an innovative digital platform. This information may assist in problem-solving complex farming issues and lead to developments and innovation for improved farming practices.
Innovation
The Agricultural Price Guide Tool uses the JpGraph charting library to access, interrogate and visualise commodity data through an interface that allows users to define the parameters and output format of a query without revealing the commercially sensitive dataset. This has replaced the previously manual process of extracting, analysing, and preparing one off reports for individual requests.
Technical Features
The Agricultural Price Guide Tool uses PHP with JpGraph, MySQL and JavaScript to provide a flexible and easy-to-use interface for generating historic commodity reports.
Users can:
- view commentary on events affecting the commodity price,
- exclude date ranges to examine the effect of events on statistical values,
- choose from statistical calculations: mean, min, max, deciles 1-10 and quartiles 1-4, and
- print the exact output of selected options
Approach
CeRDI developers worked closely with Nicon Rural Services to build an application that delivered the functionality and required outcomes for the end user. This included establishment of a database to receive and store the supplied commodity data, design of user defined input parameters and options interface, graphical display of query results in multiple formats, automatic calculation and presentation of statistics and annotations for the submitted query and print ready result outputs.
-

PARTNERS